Evidence-led market reference
Semiconductor, AI Infrastructure, Data-Center and Procurement Statistics
Each figure is shown with its measurement period, geography, source, context, and limitation. Forecasts remain labeled as forecasts; a single point is not turned into an unsupported trend line.
Validated research release figures
| Figure | Period / geography | Source | Classification | Limitation |
|---|---|---|---|---|
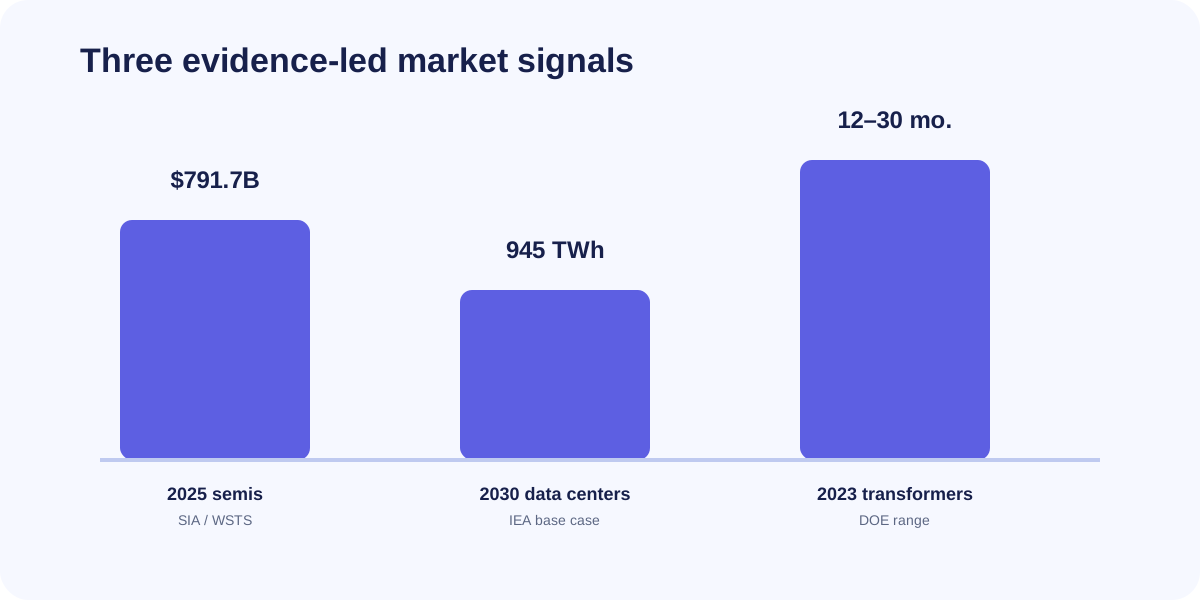
| Global semiconductor sales reached $791.7 billion in 2025. 25.6% above 2024. | 2025 Global Reviewed 2026-08-02 | Semiconductor Industry Association / WSTS ↗ Trade association release using WSTS data | Yes, with attribution | WSTS methodology and revisions should be noted. |
| Global data-center electricity consumption is projected to reach about 945 TWh in 2030. IEA Base Case; roughly double current levels. | 2030 projection Global Reviewed 2026-08-02 | International Energy Agency ↗ International organization model | Yes with Base Case label | Scenario projection. |
| U.S. data centers consumed about 4.4% of national electricity in 2023. Estimated 176 TWh. | 2023 United States Reviewed 2026-08-02 | Lawrence Berkeley National Laboratory ↗ National laboratory estimate | Yes | Model estimate. |
| U.S. data-center electricity use was projected at 325 to 580 TWh by 2028. Equivalent to 6.7%-12% in the report's scenarios. | 2028 projection United States Reviewed 2026-08-02 | Lawrence Berkeley National Laboratory ↗ National laboratory model | Yes with range | Use the full range. |
| Distribution-transformer lead times increased from 3-6 months in 2019 to 12-30 months in 2023. Supply-chain, labor and material constraints. | 2019-2023 United States Reviewed 2026-08-02 | U.S. Department of Energy ↗ Government summary | Yes | Latest cited data is 2023. |
| Alphabet reported $91.4 billion of capital expenditures in 2025, primarily reflecting technical infrastructure. Up from $52.5 billion in 2024. | 2025 Company-wide Reviewed 2026-08-02 | Alphabet / U.S. SEC ↗ Public company filing | Yes | Not all capex is addressable or semiconductor spend. |
| Meta reported $69.69 billion of property-and-equipment purchases in 2025. Associated with servers, data centers and networks. | 2025 Company-wide Reviewed 2026-08-02 | Meta Platforms / U.S. SEC ↗ Public company filing | Yes | Not identical to procurement-market revenue. |
How to use these figures
These statistics frame the procurement environment; they do not forecast Max revenue, customer demand, inventory, pricing, or a specific project's delivery. Use them to ask better system questions about compute, power, cooling, lifecycle, and evidence requirements.
Source register and research files are retained in the release repository. Claims should be rechecked against the original publisher before use in an investor, customer, regulatory, or commercial document.